A Watched Pot With A Frog In It

Back in the spring, markets reeled after Trump announced a new round of unilateral tariffs. The April 2nd announcement triggered a week of panic selling until the administration promised a temporary 90-day pause to pursue trade negotiations. Nine months later, the U.S. now has the highest tariff levels in over a century, economic data is showing signs of weakening, and discussions of a market bubble are widespread. Why, then, is the stock market still so high?

The most immediate reason is the concentration of market leadership. The “Magnificent Seven” tech giants now account for more than 35% of the S&P 500, while the top ten companies make up nearly 40%. The gap between the S&P 500 and its equal-weighted equivalent is just shy of 10%, while the Magnificent Seven themselves have delivered a combined return of roughly 27.6% year-to-date. The comparison to the dot-com era is easy to make, but the fundamental difference is profitability: Apple, Google, Microsoft, Amazon, Meta and others continue to generate substantial earnings and hold enormous balance-sheet reserves. This profitability has helped anchor market confidence.

Figure 1 Growth of the Magnificent Seven as a part of  the S&P 500

Another factor is the lag in how economic data reflects policy changes. Despite the risks tariffs pose, the full impact has not yet shown up in backward-looking data like GDP or employment reports. Investors expecting an immediate shock instead found resilient quarterly numbers, reinforcing confidence rather than shaking it.

Figure 2 Effective tariff rates over time, from the Yale Budget Lab

There is also a deeper structural issue: the increasing concentration of economic power and spending. As wealth inequality widens, a large share of U.S. households are contributing less to measured economic activity. Recent consumer expenditure data suggests that the top 10% of households now account for roughly 50% of all consumer spending, while the bottom 60% contribute less than 20%. This means that economic stress among the majority of households may not meaningfully register in the headline data that markets rely on. Meanwhile, AI-related capital investment makes up a growing share of the remainder of measured economic activity.

Figure 3 Widening wealth disparities between households and consumer spending

This combination — delayed data effects, high concentration of consumption, and sustained AI investment — has helped keep investor sentiment resilient, even as negative signals accumulate beneath the surface. It has also masked the risks of allowing speculative dynamics to develop largely unchecked.

Figure 4 Growth of Personal Consumption as a percentage of GDP

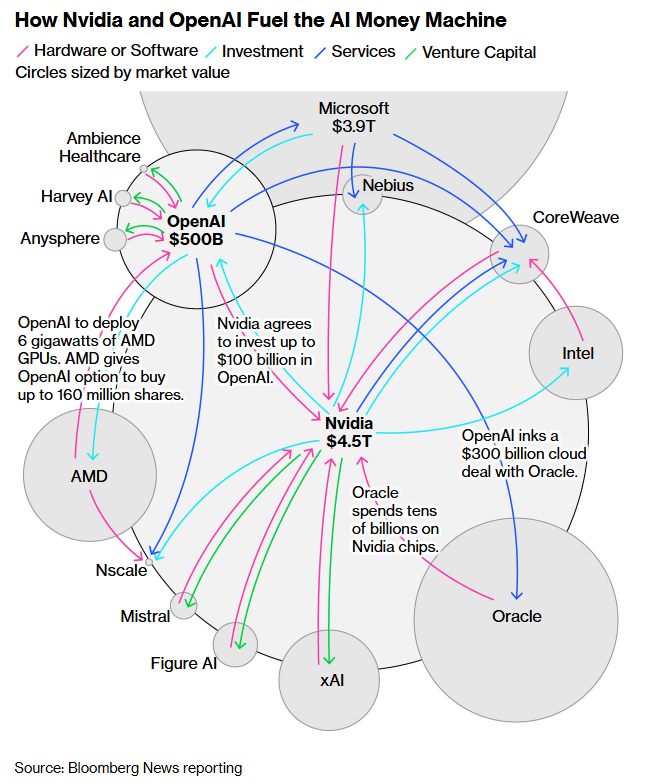
Concerns about an AI bubble are growing. Estimates of total AI investment now exceed $3 trillion when considering capital expenditures, valuations, and related infrastructure spending. Commercial use cases outside of a few sectors remain limited. Some firms have begun participating in “circular funding arrangements,” where they invest in each other’s AI initiatives to reinforce perceived valuations. Even industry leaders acknowledge the speculative environment: Sam Altman, the CEO of Open AI has said there is likely a bubble, while Jeff Bezos has called this a “good bubble” that will still produce transformative breakthroughs.

History suggests that speculative cycles are remarkably resistant to logic. They often convert skeptics into participants, including professional money managers who join in under client pressure. Market bubbles resemble the proverbial frog in a pot: the danger rises slowly enough to dull caution.

Yet they also resemble the “watched pot” that never seems to boil. As long as new capital continues to flow into AI-linked investments, momentum can persist. Predicting the end of a bubble is famously difficult — markets can remain irrational longer than investors can remain solvent.

So what should investors do? Awareness of rising risk is the starting point. We may not be able to time the end of the AI boom, but we can examine investor behavior for signs of speculative excess.

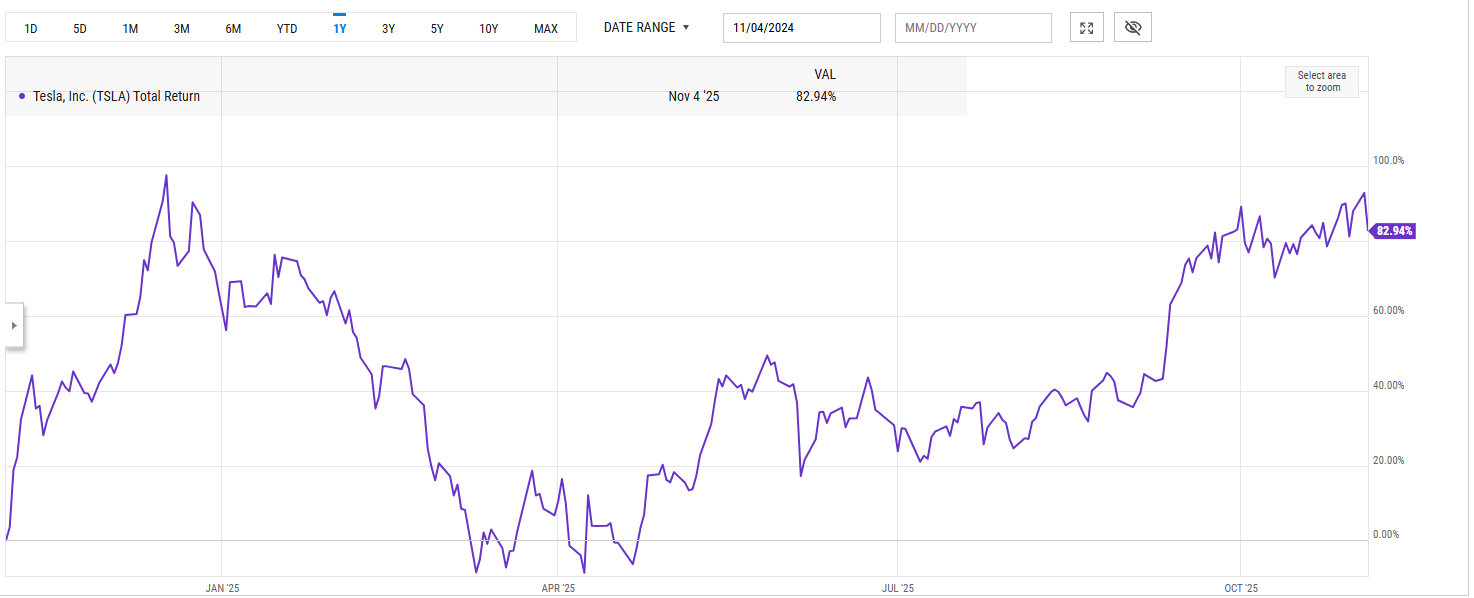
Consider Tesla. After the election, the stock surged nearly 98% in six weeks on enthusiasm linked to political alignment and narrative momentum. Since then, sales have weakened, profitability has declined, and competition has intensified — yet the stock remains 10% above its level on inauguration day and has more than doubled off its lows. Tesla’s valuation continues to reflect belief in future breakthroughs rather than current operational performance. It is a clear illustration of narrative overpowering fundamentals — a hallmark of speculative markets.

Figure 6 Tesla stock performance from November 4, 2024 to November 4, 2025

If this environment feels uncomfortable, it may be time to review portfolio risk exposure. Reducing equity risk comes with trade-offs — especially missing out on momentum-driven gains — but clarity on long-term goals can help prevent emotionally driven decision making.

Market manias are difficult to avoid and even harder to detach from when others are benefiting. The antidote is a disciplined investment plan that emphasizes long-term objectives over short-term excitement. In a world where the water may be warming around us, it is better to be a watcher than the frog.

Why Apple is a Good Lesson on Investing

Over the last few years some elements of the stock market have seemed fairly crazy. Tech stocks, often belonging to social networking sites like Twitter, have had an unbelievable run. Meanwhile Apple Computers (a favourite of mine) have frequently been heavily criticized for declining revenue growth and slowing sales numbers. Business commentators like to point to the growth in Google’s Android phone platform and its large share of the mobile phone market as proof that Apple’s days as a global leader are past.

However with Apple’s most recent earnings report out there are some important things to take note of. The chief reason that we invest in companies is because they make money, and Apple is currently one of the most profitable companies around. How profitable? Take these statistics published today in Slate.com.

If Apple’s iPhone was it’s own company it would be larger than 474 companies on the S&P 500 index and would have revenues in excess of Amazon, Coca-Cola, McDonalds, Google and E-bay. iphone.png.CROP.promovar-mediumlargeThat’s just its phone division. The iPad, whose sales numbers are definitely plateauing if not declining is still a valuable business netting $5.9 billion in revenues, greater than Facebook, Twitter, Yahoo, Groupon, and Tesla combined. ipad_1.png.CROP.promovar-mediumlargeMac Computers, which earned less than the iPad division, still garnered an impressive $5.5 billion. Even the iPod, now almost totally forgotten in the midst of smartphones and iPads still earned an impressive $442 million, 77% than Twitter’s $250 million in quarterly revenues.

Apple’s stock has periodically taken a licking, but has been beating its way back to its previous high (partly due to a recent stock split and dividends periodically being paid), but its story is an important cautionary tale.

Apple Stock Price
Apple Share Price History

Good investing comes from choosing companies that produce revenue and retain growth potential, in other words focusing on the fundamentals of investing. Despite naysayers, that’s exactly the kind of company Apple has been. So why does Apple get so much negative attention? Because predicting the fall of a Goliath is exactly the kind of thing that makes news. Whether it’s true or not is irrelevant in the news cycle, but it is a source of bad investor advice, and should serve as a cautionary tale to investors considering taking financial advice from business news.

Looking for Dark Clouds Amidst Silver Linings

628x471This year got off to a rocky start. As of writing this post, the S&P 500 is down over -2% year-to-date (YTD), while other global markets have been similarly affected. The MSCI Global Index is down nearly -1%, the MSCI Emerging Markets index is also down -4.5%, as is the FTSE 100 (UK, -1.3%) and last year’s super-performer, Japan (-12.1%). This sudden “frothiness” has brought out the fear mongers and market doom-sayers. So regularly has the drum been beaten that 2014 should see a significant slide in market value that it has become a regular question in every meeting. (note: I did not update these numbers for the current week, however many of these returns have improved. In some cases quite dramatically)

The only problem is that any internet search will easily reveal market calls for a correction EACH and EVERY YEAR! This doesn’t mean that a correction won’t happen, in fact if there is one thing that we know about the markets its that corrections do, and must happen. We also know that the longer you go without a correction the closer you must be to having one. The problem is that we place value on people who claim to be able to predict a market downturn, even when we can’t actually predict when a downturn will actually occur. So the media keeps trotting out people willing to make outlandish market predictions knowing that it will grab headlines and eventually be right.

Except….

Except that there are lots of reasons to be cautious in the current market conditions. Not that we can predict when we might actually see a downturn, but there a lot of reasons why it makes sense to have defensive positions in your portfolio. For instance, we are currently at an all time high for IPOs, the most since 1997. There is some evidence that as IPOs peak its not uncommon to see a market correction, as less valuable companies try to cash in on market exuberance and professional investors try and sell their positions in less viable companies to bullish markets.

Other market metrics also seem to favour being on the defensive. Currently there are 84 companies on the S&P 500 with shares that are valued above 10x earnings. This means that investors are incredibly bullish about the future prospects when it comes to income growth. Many of these companies are in hi-tech sectors, like social media firms such as Twitter. For the record that is the most number of companies above this valuation since prior to the tech bubble in 1999.

Share buy backs also play a role here. If you aren’t familiar, with borrowing rates still very low many companies have taken the opportunity to borrow large sums of money and buy their outstanding shares back. Why? As the number of outstanding shares in the market declines the Earnings Per-Share goes up. This means that even if a company isn’t seeing actual growth in sales, it does mean that the the remaining shares receive a greater portion on the earnings, artificially increasing their value. In of itself this isn’t a problem, but it serves to increase the stock market while not seeing much in the way of actual economic growth.

Lastly we have also seen that the flow of money into ETF funds (passive investments that mimic indices) is also adding volatility to the markets. As investors remain concerned over negative surprises in the news, the high liquidity of ETFs causes even greater short term fluctuations in the markets as investors pull back. This is especially true in the Emerging Markets, and has had the unusual side effect of showing that actively managed funds have outperformed comparable ETFs.

In summary then there are four good reasons to believe that the markets may get more turbulent going forward. The lesson however is not to commit to a wholly negative or positive view of the markets, but rather continue to hold a diversified group of assets to deal with all market surprises, both good and bad!