How Imminent is the Next Market Crash?

image001This past week I received an article from a client regarding ideas about “wealth preservation” that made some good sense, and offered advice about calculating how much money you need for retirement. But while the premise was sound; that it makes sense to pursue investment strategies that protect your nest egg when your financial needs are already met, a one off comment about the future of the stock market caught my attention.

You can read the article HERE, but the issue I wanted to look at was the not so subtle implication that the US markets were now due for a correction. A serious one. Quoting the Wall Street Journal contributing writer William J. Berstein,

“In March, the current bull market will be six years old. It might run an additional six years—or end in April.”

This isn’t the first time I’ve heard this point before. It isn’t unique and sits on top of many other market predictioner’s tools, but its use of averages gives a veneer of knowledge the writer simply doesn’t possess.

Obviously we would all like to know when a market correction is due, and it would be great to know how to sidestep the kind of volatility that sets our retirement savings back. But despite mountains of data, some of the most sophisticated computers, university professors, mathematicians and portfolio managers have yet to crack any pattern or code that would reveal when a market correction or crash should be expected.

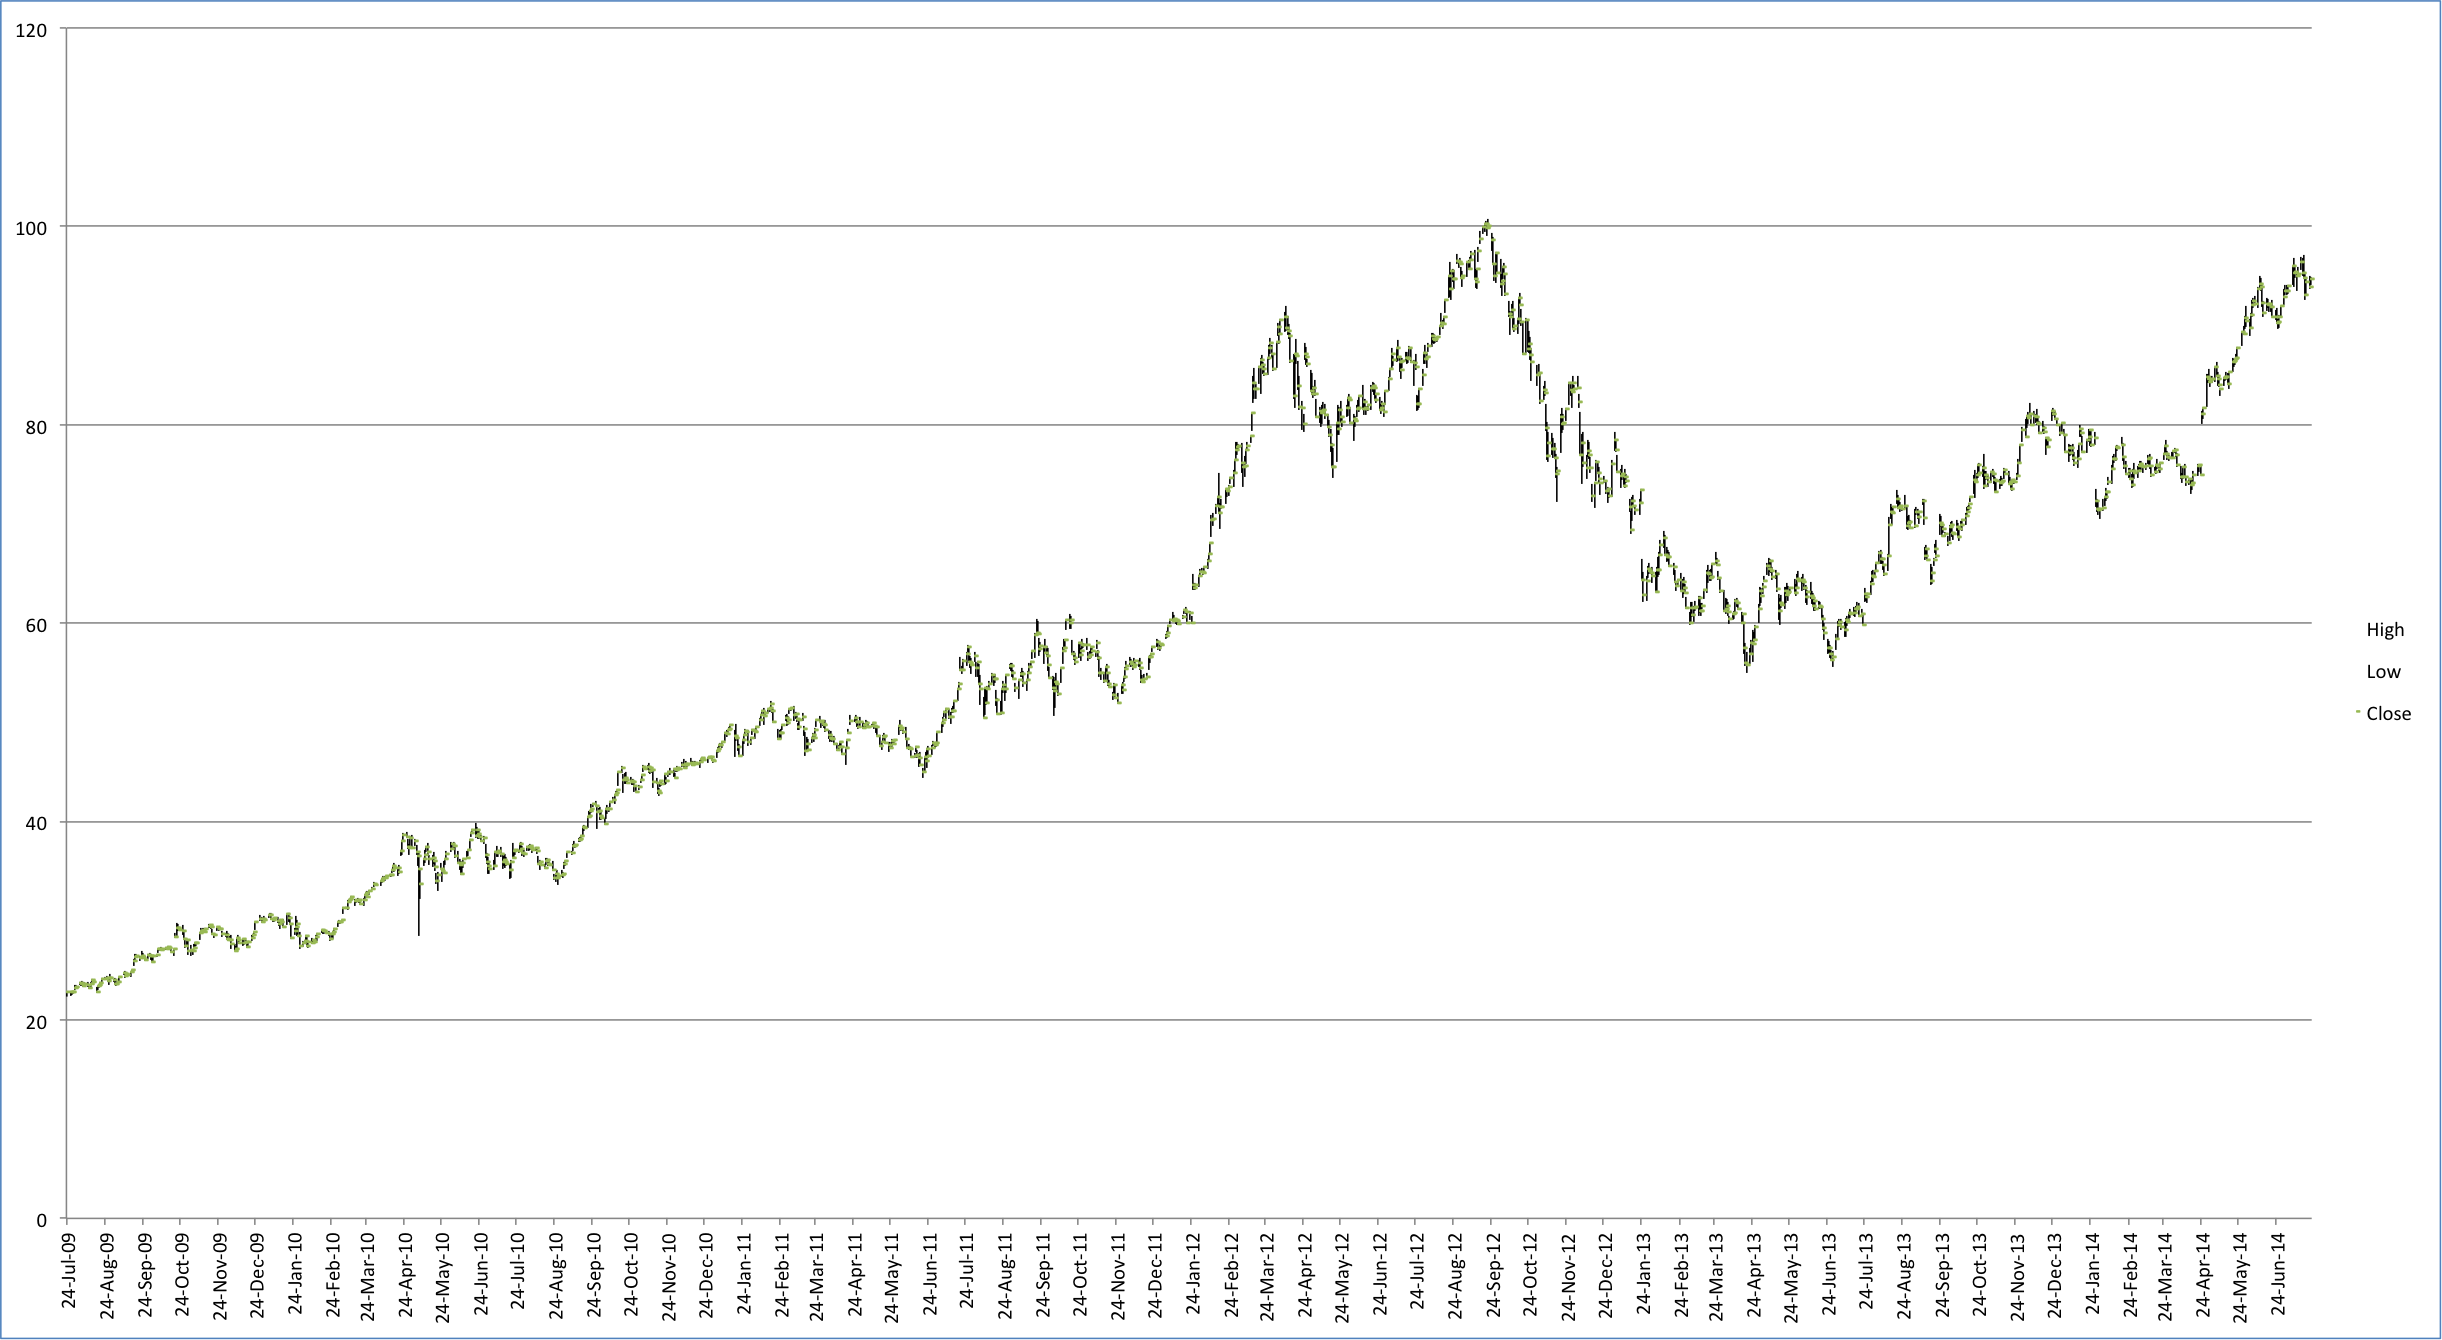
Which is why we still rely on rules of thumb like the one mentioned above. Is the age of a bull market a good indication of when we will have a correction? Probably not as good of one as the writer intends. Counting since 1871, the average duration of a bull market is around 4.5 years, making the current bull run old. But averages are misleading. For instance the bull markets that started in 1975, and 1988 (ending in 1987 and 2000 respectively) lasted for 153 months each, or just shy of 13 years. Those markets are outliers in the history of bull markets, but their inclusion in factoring the average duration of the bull markets extends the average by an additional year. Interestingly if you only count bull markets since the end of the second world war the average length is just over 8 years, but that would only matter if you think our modern economy has significant differences from an economy that relied on sailing vessels and horses.

table_us_bull_markets_since_1871

The fact is that the average age of bull markets is only that, an average. It has little bearing on WHY a bull market comes to an end. There was nothing about the age of the bull market in the 2000s, when people had become convinced of some shaky ideas about internet companies that make no money, that had any bearing on its end. The bull market that ended in 2008 had more to do with some weird ideas people had about lending money to people who couldn’t pay it back than it did with a built in expiration date. Even more importantly, the market correction of 1987 (Black Monday) was an interruption in what was an otherwise quarter century of solid market gains.

Taking stabs at when a market correction will occur by using averages like duration sounds like mathematical and scientific rigour, but actually reveals very little about what drives and stops markets. And a quick survey of the world tells us a great deal more about global financial health and where potential opportunities for investment are than how long we’ve been the beneficiaries of positive market gains.

Only Time Gives Clarity to Investors

The reality of the 21st century is that finding clarity in world events for investors is almost impossible. Take the recent price drop in oil, which has been hailed as both a good and bad thing. And as the new lower price of energy slowly becomes the norm, everyday news reports come in about its respective benefits and unintended negative consequences.

https://twitter.com/Walker_Report/status/540161044786589698

Those seeking to know what those events mean and what guidance headlines should give will only be frustrated by the almost endless supply of information that seeks to empower decisions but leaves many scratching their heads in wonder about the future.

Screen Shot 2014-12-03 at 8.36.05 PM

A big reason for this is the sheer volume of information that we can now rely on. Since the advent of computers and the more recent rise of high-speed communication and networking we have found that the core truth of an event still isn’t apparent until after something has happened. In other words it’s almost impossible to predict corrections before they happen despite an almost inconceivable amount of data and endless ability to process it.

This is true no matter where we look in the world of investing. Consider Black Friday, the end all and be all day in shopping in the United States. This year Black Friday seemed to fizzle. Sales were down 11% year-over-year and that got people nervous. Yet Cyber Monday, the electronic version of Black Friday, sales were up 17% and topped $2 billion for the first time. Combined with the longer sales period leading up to the weekend, many suspect that total sales were actually higher.

All of this data conflicts with each other, which for investors means sometimes you will be wrong. Small things sometimes prove to be big things, and what initially appears simple turns out to be surprisingly complex, and much of it you simply won’t predict. This points investors back to some dull but surprising truths about investing.

1. Not much has changed when it comes to determining what makes a company worthwhile to invest in. Corporate health, sound governance and healthy cash flow still tell us more than loud hype about potential new markets, new products and new trends.

2. Time is a better arbiter than you about investing. The old line is time in the market, not timing the market, and that still appears true. Many Canadians are likely wringing their hands about the sudden drop of oil and the impact it is having on their portfolios. But the best course of action maybe not to abandon their investments, but make sure they are still sensibly invested and well diversified. The market still tends to correct in the long run and immediate volatility (both up and down) are smoothed out over time.

Screen Shot 2014-12-04 at 2.48.01 AM
The S&P 500 over the last 50 years. From Yahoo Finance

Not every sensible investment will work out, but a portfolio of sensible investments over time will. For investors now wondering about the future and their investments in Canada, the best thing to do is understand the logic behind their investments before choosing a course of action.


America Is In Great Shape; Be Afraid!

markets_1980043cAll year people have been expecting a correction in the US Markets. For most of the year I have listened to portfolio managers discuss their “concern” about the high valuations of American companies. I have also listened to them point out that America remains the strongest economy and the most likely to see significant growth in the coming year.

Flash forward to late-September, early October and the markets have finally had their corrections. At the bottom every market was negative, including the TSX which had given up all of its YTD high of 15%. That was the bottom. The recovery was swift, money flowed back into the markets, and hedge fund managers managed to make a mockery of some otherwise nervous DIY investors. Now the markets look strong again, with the S&P 500 reaching new highs. Nobody is happy.

All of this comes on the news that US GDP was up 3.9% in the third quarter, a full .5% above analyst expectations (that sounds small, but it’s worth billions) while energy prices continue to decline, manufacturing is highly competitive and US consumers look poised for a significant Christmas bonanza. So what’s wrong with this picture? Why are both the Globe and Mail and the Financial Times worried about the US stock market?

https://twitter.com/Walker_Report/status/537581249440014337

FullSizeRender

The answer is a combination of fear, data, and the insatiable need for stories to populate the media everyday. First is the fear. Stocks are at all time highs. The problem is that “all time high” isn’t some automatic death sentence for a stock market. The stock market always hits new highs all the time, and a by-product of that is that corrections can really only happen after a high is reached. Look at the history of the S&P 500 since 1960:

Screen Shot 2014-11-26 at 11.02.50 AMAs you can probably tell, there are a lot of “new highs” that had occurred over the last 40 years, but each new high did not automatically translate into some automatic correction. There were legitimate reasons why the economy could continue to grow, and in the process make those companies in the stock market more valuable. That isn’t to say that the stock market can’t be “frothy” or that their aren’t problems in the stock market today. It merely means that setting a new market high isn’t proof of an impending collapse.

The second issue is data. We live in an age of Big Data. Data is everywhere and there is so much it can be hard to separate the useful data from the useless. Some of the data is concrete, but much of it takes time to understand or even become clear. The first analysis of the higher than expected GDP numbers seemed great (more economy, Yay!) but upon closer inspection, there are reasons to be cautious. While the GDP was higher than expected, it was largely due to growth in government spending, not consumer spending. In fact consumer spending was lower quarter over quarter. In addition there are a number of concerns about how corporations are spending their profits and whether that is sustainable. Many of these concerns, when taken in context, seem to be the same from earlier in the year.

The third factor is the insatiable need to write something. Content is king in the news world and providing insight (read: opinion) means that you must constantly produce new stories to publish. That means that there is a need to be constantly suggesting that things are about to go wrong (or more wrong than they already have) to create a compelling story. It isn’t that these stories are wrong, just that constantly saying the stock market is going to go down isn’t insightful, since at some point we can expect the stock market to correct for one of a number of reasons.

So is America frothy? Are we poised an some kind of financial collapse? I don’t know, and nobody else does either. We are no more likely to correctly know when the market might correct again than we are to guess the future price of gas. The best response is to diversify, and remember some core elements of investing. Buy low and sell high. With that in mind sturdy investors should probably start giving the beat-up and maligned Europe a second look…

The Media is Turning Market Panic up to 11 – Learn to Tune Them Out

The current market correction is about as fun as a toothache. Made up of a perfect storm of negative sentiment, a slowing global economy and concerns about the end of Quantitative Easing in the US have led to a broad sell-off of global markets, pretty much wiping out most of their gains year-to-date.

Screen Shot 2014-10-15 at 3.38.09 PM
This is what my screen looked like yesterday (October 15th, 2014). The little 52L that you see to the left of many stock symbols means that the price had hit a 52 week low. The broad nature of the sell off, and indiscriminate selling of every company, regardless of how sound their fundamentals tells us more about market panic than it does about the companies sold.

One of the focal points of this correction has been the price of oil, which is off nearly 25% from its high in June. Oil is central to the S&P/TSX, making up nearly 30% of the index. Along with commodities, energy prices are dependent on the expectation of future demand and assumed levels of supply. As investor sentiment have come to expect that the global demand will drop off in the coming year the price of oil has taken a tumble in the last few weeks. Combined with the rise of US energy output, also known as the Shale Energy Revolution, or fracking, the world is now awash in cheap (and getting cheaper oil).

Screen Shot 2014-10-16 at 12.32.36 PM
The price of Brent Crude oil – From NASDAQ

But as investors look to make sense out of what is going on in the markets they would be forgiven if all they learned from the papers, news and internet sites was a barrage of fear and negativity masquerading as insight and knowledge. The presumed benefit of having so much access to news would be useful and clear insight that could help direct investors on how to best manage the current correction. Instead the media has only thrown fuel on the fire, fanning the flames with panic and fear.

WTI & BrentContrast two similar articles about the winners and losers of a dropping price of oil. The lead article for the October 15th Globe and Mail’s Business section was “Forty Day Freefall”, which went to great lengths to highlight one big issue and then cloak it in doom. The article’s primary focus is the price war that is developing between OPEC nations and North American producers. Even as global demand is reportedly slowing Saudi Arabia is increasing production, with no other OPEC nations seemingly interested in slowing the price drop or unilaterally cutting production. The reason for this action is presumably to stem the growth of oil sand and shale projects, forcing them into an unprofitable position.


This naturally raises concerns for energy production in Canada, but it is not nearly the whole story. The Financial Times had a similar focus on what a changing oil price might mean to nations, and its take is decidedly different. For instance, while oil producing nations may not like the new modest price for oil, cheap oil translates into an enormous boon for the global economy, working out to over $600 billion a year in stimulus. In the United States an average household will spend $2900 on gas. Brent oil priced at $80 turns into a $600 a year tax rebate for households. Cheaper oil is also hugely beneficial to the manufacturing sector, helping redirect money that would have been part of the running costs and turning them into potential economic expansion. It’s useful as well to Emerging Economies, many of which will be find themselves more competitive as costs of production drop on the back of reduced energy prices.

A current map of shale projects, and expected shale opportunities within the United States and Canada.

Business Reporting isn’t about business, it’s about advertising revenues.

While Canada may have to take it on the chin for a while because of our market’s heavy reliance on the energy sector, weakening oil prices also tends to mean a weakening dollar, both of which are welcomed by Canadian manufacturers. Corrections and changing markets may expose weaknesses in economies, but it should also uncover new opportunities. How we report these events does much to help investors either take advantage of market corrections, or become victims of it. As we wrote back in 2013, business reporting isn’t about business, it’s about advertising revenues. Pushing bad news sells papers and grabs attention, but denies investors guidance they need.

If I Tell You This is Just a Correction, Will You Feel Better?

19_6_origA correction is typically defined as a drop of roughly 10% in the markets over a very short period of time. It’s often “welcomed” by investment professionals because it creates opportunities for new investments into liked companies that were previously trading above valuations considered appealing. Corrections are talked about as being necessary, beneficial and part of a normal and healthy market cycle, which all makes it sound somewhat medical. But in medical terms it falls under the category of being told your are about to receive 5 injections in short order and they are all going to hurt.

Screen Shot 2014-10-02 at 7.22.55 AM
S&P TSX From Bloomberg – October 2, 2014

For investors the past couple of weeks in the market has felt like many such injections. The US markets have had a significant sell off, as have the global, emerging, and Canadian markets. All of it very quickly. The sudden drop has erased many of the gains in an already slow year and eaten dramatically into the TSX’s return which had been one of the best.

From Bloomberg - October 2, 2014
Dow Jones Industrial From Bloomberg – October 2, 2014

For many investors any sudden change in the direction of the markets can immediately give the sense that we are heading into another 2008. As Canadian (and American) investors are now 6 years older and closer to retirement the stakes also seem much higher. So here are some reasons why you shouldn’t be concerned about the most recent market volatility, and what you can do to make them work to your advantage.

1. Everyone is nervous.

For several months people have been calling for a correction. Investor sentiment is neutral and consumer confidence has dipped, meaning that overall atmosphere is somewhat negative for the markets. But that can be a good thing. Market crashes and bust cycles typically show up when people are exuberant and feel euphoric about markets. Bad news is swept aside and the four most dangerous words in investing “This time it’s different” become the hallmark of the new bubble. It’s rare that negativity breeds an over exuberant market.

2. The Economy isn’t running on all cylinders.

There certainly have been encouraging numbers in the United States, and even recently Canada has had some improved economic numbers, but by and large there hasn’t been a big expansion yet in the economy. Unemployment is still high, especially in Europe and the labour force has shrunk (which can skew the unemployment numbers) while corporations continue to sit on enormous piles of cash, to their detriment. A market crash usually follows an overheated economy that begins to over-produce based on faulty views about future growth potential. That isn’t where we are yet.

3.  Corporations are really healthy, and so are investors.

Canadians may still have bundles of debt, but the US is a different story. American corporations and households have been heavily deleveraging since 2008. In fact corporations in the US look to be some of the healthiest in decades, showing better earnings to debt ratios than previously thought. Crashes have as much to do with over-production as they do with out-of-control borrowing. The two go hand in hand and both factors are currently missing from the existing economic landscape.

4. Energy is cheap. Like, really cheap. 

Remember when oil was more than $100 a barrel? High energy prices, and the expectation of future high energy prices can really put the kibosh on future returns and throw cold water all over the market. As we’ve previously said, energy is the lifeblood of civilizations and a steady supply of affordable energy is what separates great economies from poor ones. (Look, we tweeted this earlier! See, twitter is useful. Follow us @Walker_Report)

https://twitter.com/Walker_Report/status/517604263493894145

West Texas Crude Oil Price over the last 3 months - from NASDAQ - October 2, 2014
West Texas Crude Oil Price over the last 3 months – from NASDAQ – October 2, 2014

The arrival and growth of American gas production combined with changing technologies and increasing efficiencies on existing energy use means that global demand is slowing, while global supply is increasing. In fact in March of last year, the head analyst for energy at Citigroup published a paper describing exactly this trend of improved efficiency with new sources as a mix for lower energy prices in the long term. Whether this proves true over the next two decades is hard to say, but what is true is that cheap energy helps economies while expensive energy hinders it. Since economies have already adjusted to the higher price over the last few years, a declining price is a tailwind for growth.

Does this mean that there aren’t any risks in the market? Absolutely not. Europe is having a terrible year as a result of persistent economic problems and Russian intransience, and many Emerging Markets are showing the strain of continued growth, either through corruption or exceeding optimism about the future. Those pose real risks, but taken in the grand scheme of things our outlook remains positive for the markets.

How can I make this all work for me?

So what can you do as an investor to make a correction benefit you? The first piece of advice is always the same. Sit tight. Dramatic changes to your investments when they are down tends to lead to permanent losses. Secondly, rebalance your account periodically as the market declines. On the whole equity funds will lose a greater proportion of their value than fixed income, leaving a balanced portfolio heavier in conservative than growth investments. Rebalancing gives you a chance to buy more units of growth funds at a lower price while adding greater potential for upside as the market recovers. Lastly, if you have money sitting on the sidelines, down markets are great opportunities to begin Dollar-Cost-Averaging. For nervous investors this is a great way to ease into the markets even as markets look unstable. You can read about it here, but I recommend watching the movie below for a nice visual explanation. Now, take your medicine.

Correlation: Or How I Learned to Stop Worrying About the Market and Love Diversification

140617strangelove
The look of a nervous investor who needs more diversification

This year has seen further gains in the stock market both in Canada and the United States. But after five straight years of gains (the US is having its third longest period without a 10% drop) many are calling for an end to the party.

Calling for a correction in the markets isn’t unheard of, especially after such a long run of good performance. The question is what should investors do about it? Most financial advisors and responsible journalists will tell you to hold tight until it 1. happens, and 2. passes. But for investors, especially post 2008, such advice seems difficult to follow. Most Canadians with any significant savings aren’t just five years closer to retiring than they were in 2008, they are also likely considering retirement within the next 10 years. Another significant correction in the market could drastically change their retirement plans.

Complicating matters is that the investing world has yet to return to “normal”. Interest rates are at all time lows, reducing the returns from holding fixed income and creating a long term threat to bond values. The economy is still quite sluggish, and while labour numbers are still slack, labour participation will likely never return to previous highs as more and more people start retiring. Meanwhile corporations are still sitting on mountains of cash and haven’t really done much in the way of revenue growth, but share prices continue to rise making market watchers nervous about unsustainable valuations.

In short, it’s a confusing mess.

My answer to this is to stay true to principles of diversification. Diversification has to be the most boring and un-fun elements of being invested and it runs counter to our natural instincts to maximize our returns by holding investments that may not perform consistently. Diversification is like driving in a race with your brakes on. And yet it’s still the single most effective way to minimize the impacts of a market correction. It’s the insurance of the investing world.

This is not you, please do not use him as your investing inspiration.

The challenge for Canadians when it comes to diversifying is to understand the difference between problems that are systemic and those that are unique. The idea is explained well by Joseph Heath in his book Filthy Lucre. Using hunters trying to avoid starvation he notes that “10 hunters agree to share with one another, so that those who were lucky had a good day give some of their catch to those who were unlucky and had a bad day…the result will be a decrease in variance.” This type of risk pooling is premised off the idea “that one hunter’s chances of coming home empty handed must be unrelated to any other hunter’s chances of coming home empty handed.”  Systemic risk is when “something happens that simultaneously reduces everyone’s chances of catching some game.” This is why it is unhelpful to have more than one Canadian equity mutual fund in a portfolio, and to be cognizant of high correlation between funds.

The question investors should be asking is about the correlation between their investments. That information isn’t usually available except to people (like myself) who pay for services to provide that kind of data. But a financial advisor should be able to give you insight into not just the historic volatility of your investments, but also how closely they correlate with the rest of the portfolio.

Sadly I have no insights as to whether the market might have a correction this year, nor what the magnitude of such a correction could be. For my portfolio, and all the portfolios I manage the goal will be to continue to seek returns from the markets while at the same time finding protection through a diversified set of holdings.


Why Apple is a Good Lesson on Investing

Over the last few years some elements of the stock market have seemed fairly crazy. Tech stocks, often belonging to social networking sites like Twitter, have had an unbelievable run. Meanwhile Apple Computers (a favourite of mine) have frequently been heavily criticized for declining revenue growth and slowing sales numbers. Business commentators like to point to the growth in Google’s Android phone platform and its large share of the mobile phone market as proof that Apple’s days as a global leader are past.

However with Apple’s most recent earnings report out there are some important things to take note of. The chief reason that we invest in companies is because they make money, and Apple is currently one of the most profitable companies around. How profitable? Take these statistics published today in Slate.com.

If Apple’s iPhone was it’s own company it would be larger than 474 companies on the S&P 500 index and would have revenues in excess of Amazon, Coca-Cola, McDonalds, Google and E-bay. iphone.png.CROP.promovar-mediumlargeThat’s just its phone division. The iPad, whose sales numbers are definitely plateauing if not declining is still a valuable business netting $5.9 billion in revenues, greater than Facebook, Twitter, Yahoo, Groupon, and Tesla combined. ipad_1.png.CROP.promovar-mediumlargeMac Computers, which earned less than the iPad division, still garnered an impressive $5.5 billion. Even the iPod, now almost totally forgotten in the midst of smartphones and iPads still earned an impressive $442 million, 77% than Twitter’s $250 million in quarterly revenues.

Apple’s stock has periodically taken a licking, but has been beating its way back to its previous high (partly due to a recent stock split and dividends periodically being paid), but its story is an important cautionary tale.

Apple Stock Price
Apple Share Price History

Good investing comes from choosing companies that produce revenue and retain growth potential, in other words focusing on the fundamentals of investing. Despite naysayers, that’s exactly the kind of company Apple has been. So why does Apple get so much negative attention? Because predicting the fall of a Goliath is exactly the kind of thing that makes news. Whether it’s true or not is irrelevant in the news cycle, but it is a source of bad investor advice, and should serve as a cautionary tale to investors considering taking financial advice from business news.

Looking for Dark Clouds Amidst Silver Linings

628x471This year got off to a rocky start. As of writing this post, the S&P 500 is down over -2% year-to-date (YTD), while other global markets have been similarly affected. The MSCI Global Index is down nearly -1%, the MSCI Emerging Markets index is also down -4.5%, as is the FTSE 100 (UK, -1.3%) and last year’s super-performer, Japan (-12.1%). This sudden “frothiness” has brought out the fear mongers and market doom-sayers. So regularly has the drum been beaten that 2014 should see a significant slide in market value that it has become a regular question in every meeting. (note: I did not update these numbers for the current week, however many of these returns have improved. In some cases quite dramatically)

The only problem is that any internet search will easily reveal market calls for a correction EACH and EVERY YEAR! This doesn’t mean that a correction won’t happen, in fact if there is one thing that we know about the markets its that corrections do, and must happen. We also know that the longer you go without a correction the closer you must be to having one. The problem is that we place value on people who claim to be able to predict a market downturn, even when we can’t actually predict when a downturn will actually occur. So the media keeps trotting out people willing to make outlandish market predictions knowing that it will grab headlines and eventually be right.

Except….

Except that there are lots of reasons to be cautious in the current market conditions. Not that we can predict when we might actually see a downturn, but there a lot of reasons why it makes sense to have defensive positions in your portfolio. For instance, we are currently at an all time high for IPOs, the most since 1997. There is some evidence that as IPOs peak its not uncommon to see a market correction, as less valuable companies try to cash in on market exuberance and professional investors try and sell their positions in less viable companies to bullish markets.

Other market metrics also seem to favour being on the defensive. Currently there are 84 companies on the S&P 500 with shares that are valued above 10x earnings. This means that investors are incredibly bullish about the future prospects when it comes to income growth. Many of these companies are in hi-tech sectors, like social media firms such as Twitter. For the record that is the most number of companies above this valuation since prior to the tech bubble in 1999.

Share buy backs also play a role here. If you aren’t familiar, with borrowing rates still very low many companies have taken the opportunity to borrow large sums of money and buy their outstanding shares back. Why? As the number of outstanding shares in the market declines the Earnings Per-Share goes up. This means that even if a company isn’t seeing actual growth in sales, it does mean that the the remaining shares receive a greater portion on the earnings, artificially increasing their value. In of itself this isn’t a problem, but it serves to increase the stock market while not seeing much in the way of actual economic growth.

Lastly we have also seen that the flow of money into ETF funds (passive investments that mimic indices) is also adding volatility to the markets. As investors remain concerned over negative surprises in the news, the high liquidity of ETFs causes even greater short term fluctuations in the markets as investors pull back. This is especially true in the Emerging Markets, and has had the unusual side effect of showing that actively managed funds have outperformed comparable ETFs.

In summary then there are four good reasons to believe that the markets may get more turbulent going forward. The lesson however is not to commit to a wholly negative or positive view of the markets, but rather continue to hold a diversified group of assets to deal with all market surprises, both good and bad!


All Time High Doesn’t Equal Bubble

iStockphoto 046On more than one occasion I have been quizzed about the future of some stock market-or-other to the lack of satisfaction of the quizzer. Invariably the conversation goes something like: “What with all the money being printed and the new highs of the stock market, shouldn’t it all come down?” And my answer is usually, “No.”

This is frustrating for people because there is a real feeling that the stock market in the United States should not be doing as well as its doing. Some of this comes from the incongruity of negative media reports about the US economy and the ever growing stock market, some comes from the lingering shock of 2008, and some from an intellectual class that feel that our economic future is built on sand.

But a large reason for my belief in future growth is in looking past the fear of “big numbers.” When the stock market has a correction it’s often pointed out that it had just reached new highs. But this doesn’t mean that all new highs equal a market correction. The subtext is that there must be some limit to the growth in the market and that a new “all time high” must transcend this natural barrier, creating a bubble.

This is a populist understanding of market bubbles and has little to do with reality. The market should grow and reflect a burgeoning economy, and while the American economy has struggled its companies have continued to post substantial profits and many of them have either continued to grow in the slower market, or have begun to offer or expand dividends, making them more attractive. 

The simple truth is crashes happen at market highs, but not because of them. Bubbles are not simply a quickly growing market, but represent a detachment between market fundamentals and a rapidly rising price, fed by the enthusiasm for rapidly growing prices.